Nimbus
A cloud operations console with a live CI/CD pipeline.
Overview
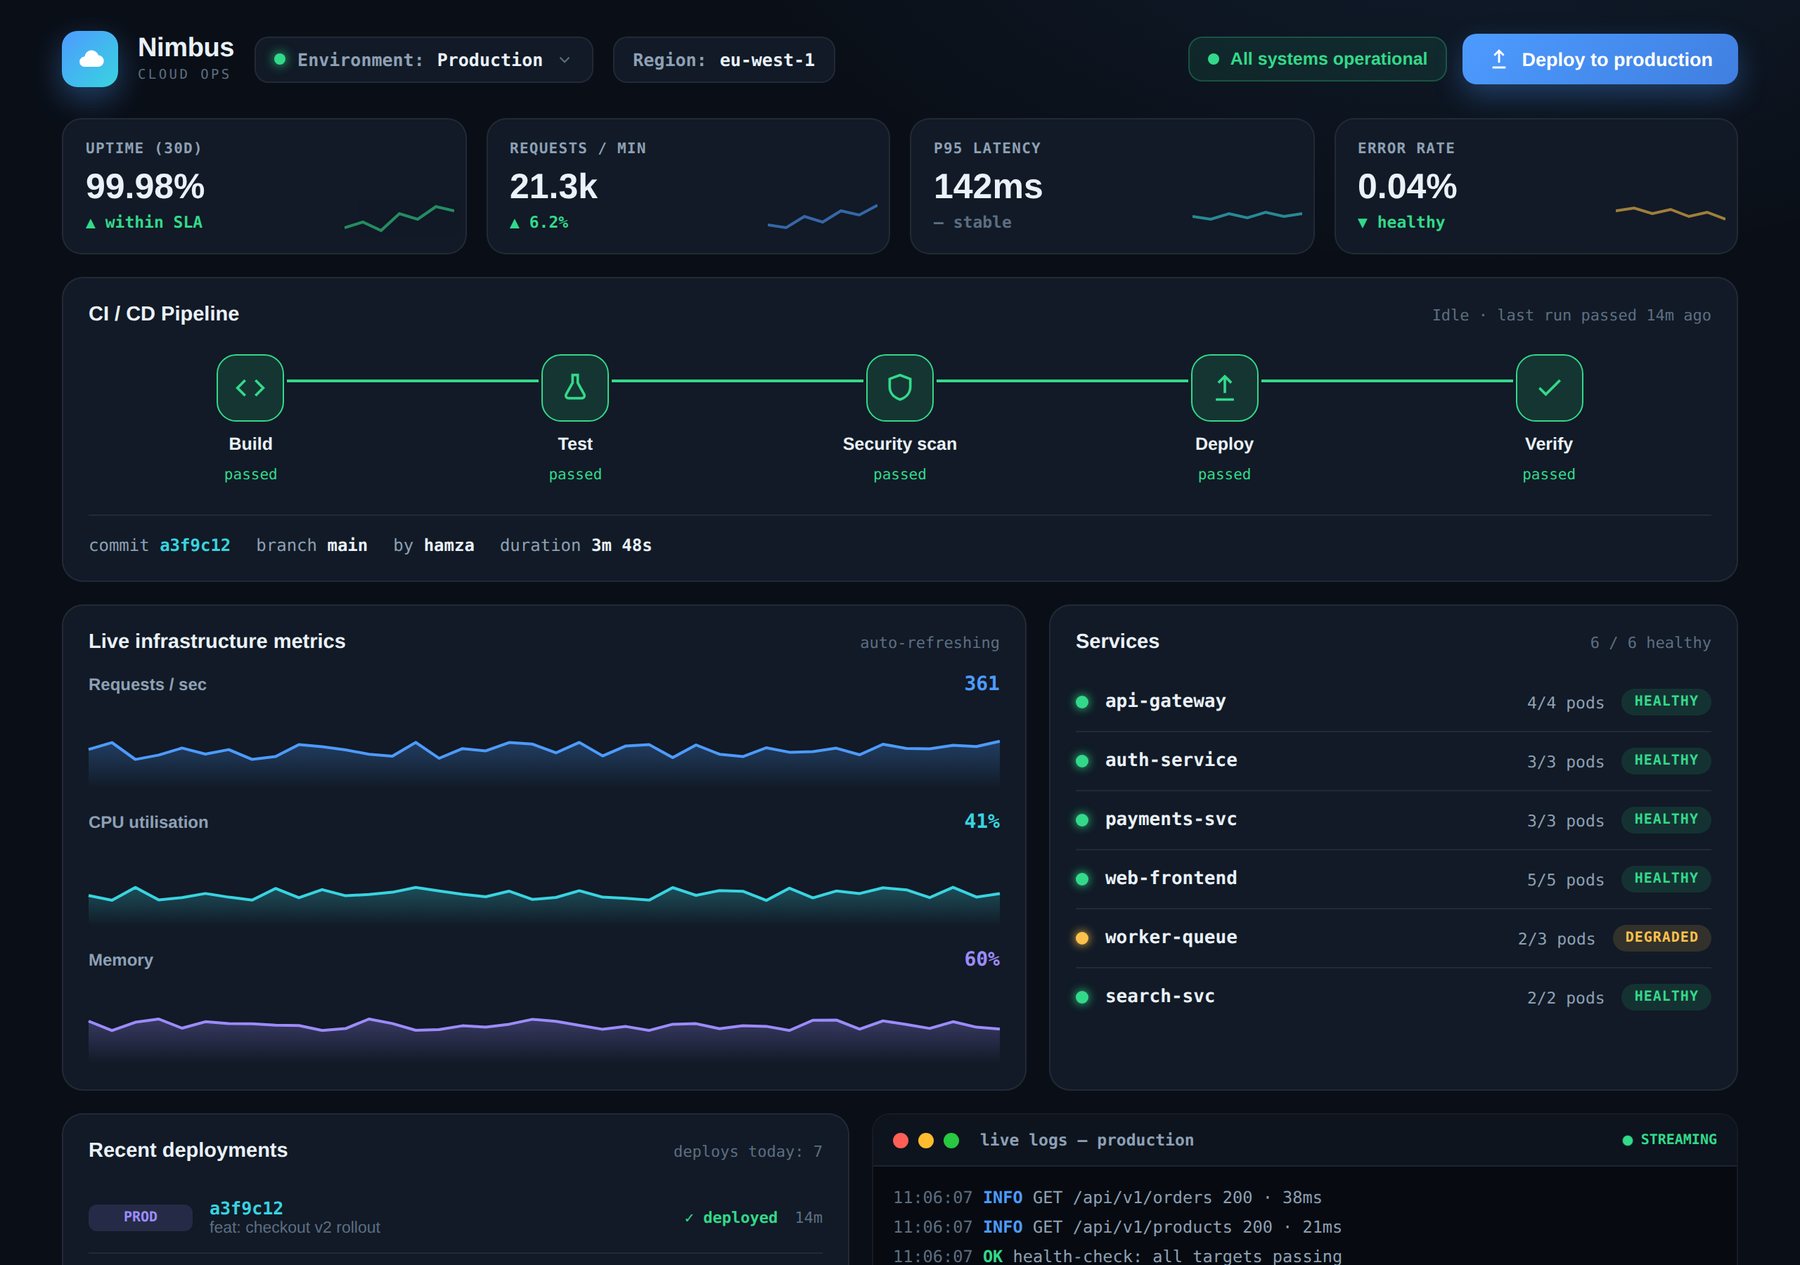
Nimbus is a Cloud Ops dashboard demo that shows how we visualise infrastructure and delivery. It brings deployments, service health, metrics and logs into one control room.
Hit ‘Deploy’ and a full CI/CD pipeline runs stage by stage — Build, Test, Scan, Deploy, Verify — while metrics update and logs stream live. Sample data, real product feel.
What it does
Screenshots
Why we built it
Shipping software reliably means seeing everything in one place — deployments, service health, metrics and logs. Nimbus is a Cloud Ops console demo that brings all of that into a single control room and lets you watch a full CI/CD pipeline run, stage by stage.
The purpose is to show how we visualise complex infrastructure so teams can act fast and with confidence. It's the same observability thinking behind the cloud and DevOps work we deliver for clients.
How we built it
Define the control room
We decided what an operator needs at a glance — pipeline, health, metrics and logs — and laid it out as one view.
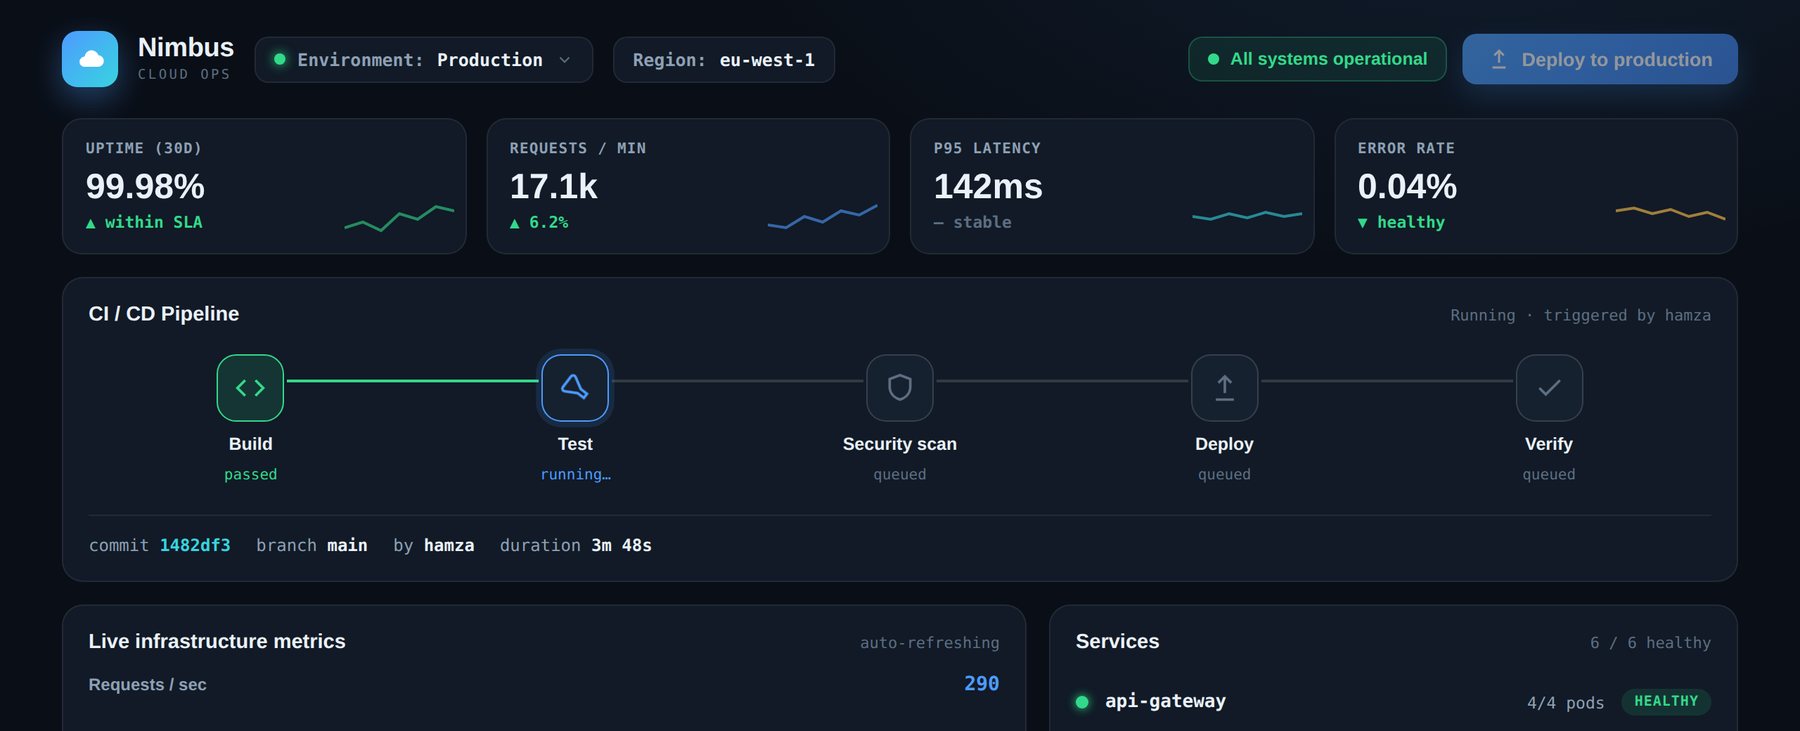
Animate the pipeline
Triggering a deploy runs Build → Test → Scan → Deploy → Verify with live, flowing status.
Stream the signals
Metrics charts and a production-style log terminal update in real time for a true ops feel.
Ship it live
Deployed as an interactive demo on sample data with a real product feel.